Originally published on Carto.
With Electric Vehicles now making up 14% of global vehicle sales, the need for reliable, location-driven public charging infrastructure is becoming ever more important.
Although the need for more public charging infrastructure is obvious, it is not so easy to determine exactly where, when and what type of infrastructure is needed. In order to answer these questions, accurate and detailed data about the existing public charging network infrastructure is critical.
This is exactly what our new data partner – Eco-Movement – is delivering.
As new CPO (Charge Point Operators) networks are established, new infrastructure gets deployed and old infrastructure gets removed, Eco-Movement updates a real-time database of EV charging locations – the most comprehensive and accurate of its kind. The data contains over 25 different attributes at location, EVSE (Electric Vehicle Supply Equipment) and connector levels.
“We are very excited about the new partnership with CARTO. Our data, now available in the Data Observatory, can be easily analyzed in relation to the variety of data available in CARTO’s Data Observatory, such as vehicle movements and road network, demographics, existing points of interest.”, says Steven Schulting.
"This allows users to create valuable insights and help CPOs, OEMs, Utility & Engineering companies, the Public Sector and others make more informed business decisions when planning, installing, and operating EV charging infrastructure."
Steven Schulting, Head of Business Development at Eco-Movement.

A global dataset
It is hard to obtain complete data on the EV charging infrastructure due to the fragmented ecosystem and the lack of global standards. Eco-Movement has established a unique position to make EV charging station data easy and accessible through close partnerships with CPOs. They specialize in aggregating, normalizing, and validating data from CPOs, enriching it with a variety of other data sources so that users can access a single, consistent database of charging locations with more than a million connectors.
Data for all public and semi-public EV charging networks is currently available for over 70 countries with new countries being added frequently.
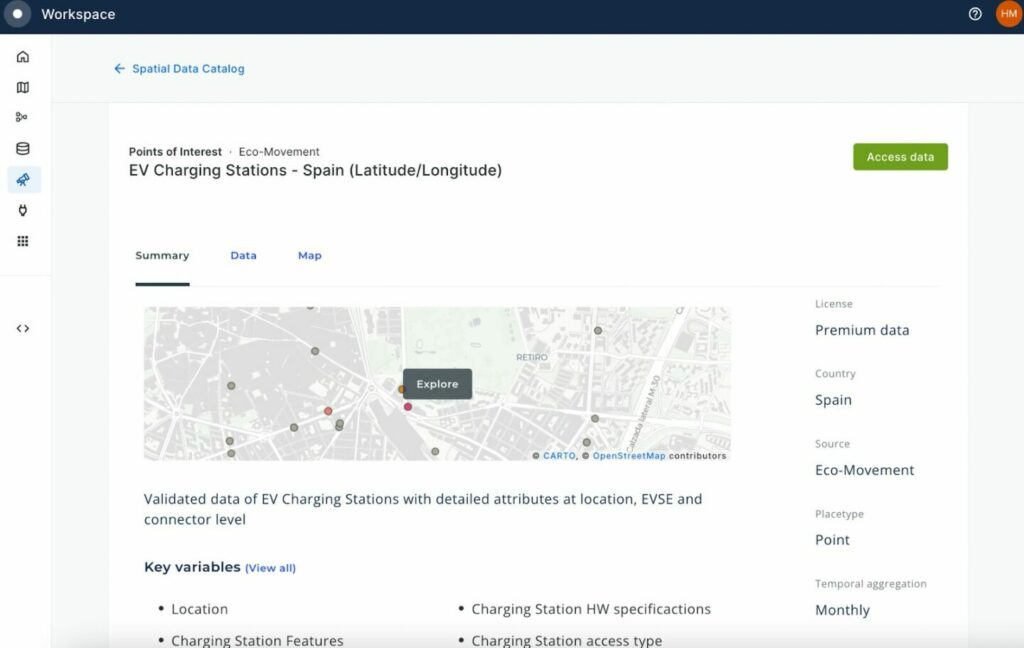
CARTO users can now request a subscription for this dataset directly from our Spatial Data Catalog. This subscription allows you to access this data on the cloud – no complex and time-consuming ETL required! Not a CARTO user yet? Sign up here for a free 14-day trial!
A wide set of attributes
The dataset contains unique IDs for every location and EVSE (Electric Vehicle Supply Equipment), and multiple location references such coordinates, address, postal code, municipality, and country.
Users can also access practical information like operator, opening times, access restrictions and type of location (e.g. along_motorway,, parking_garage, etc. ), facilities, and many technical attributes such as power, amperage, voltage, as well as the manufacturer and model of the hardware for DC stations .
How can I use this data?
Geospatial analysts and data scientists can make use of Eco-Movement’s EV charging station data for a variety of purposes, such as:
- Optimizing Charging Infrastructure Placement: The data can be used toidentify optimal locations for the placement of new EV charging stations. By analyzing existing infrastructure, traffic patterns, and demographic data, it can be determined where additional stations are needed to serve the growing electric vehicle market (see below).
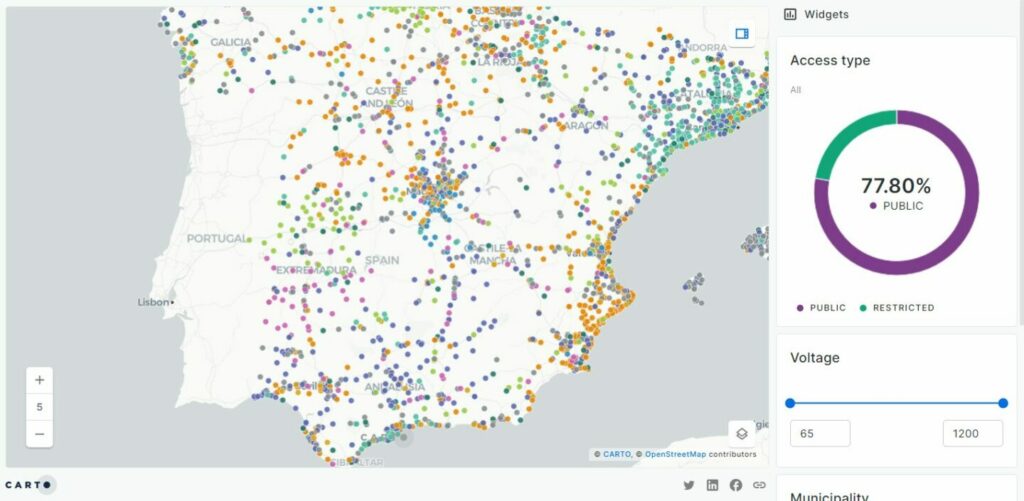
- Charging Network Optimization: Toanalyze the distribution of existing charging stations, their technical attributes (e.g. power, amperage, voltage), and user preferences to ensure that the network is efficient and serves the needs of different types of electric vehicle.
- Market Research and Strategy: Combine the charging infrastructure data with data such as mobility patterns and consumer insights to make informed decisions regarding EV charging infrastructure investments and services.
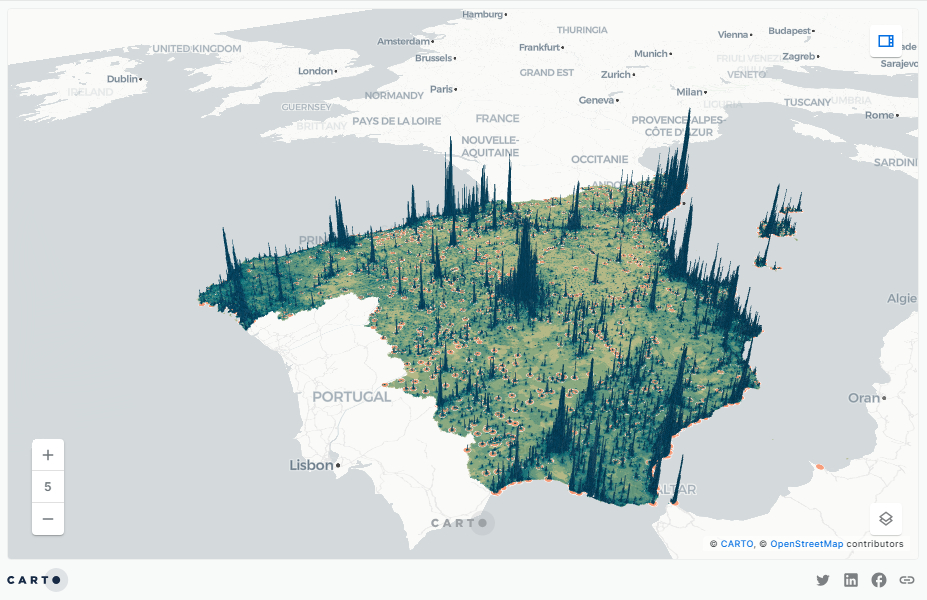
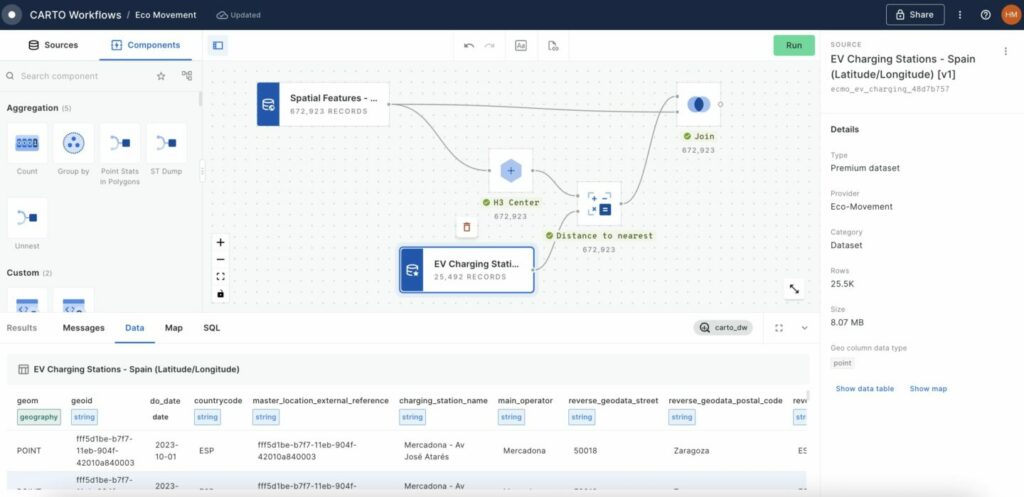
This analysis was carried out with a simple workflow – our low-code, multi-step analytical interface. In this workflow (see below), the distance from the center of each H3 cell to the nearest EV charging point is calculated, which is then joined back to the source data to allow for cross-referencing between the new “nearest distance” variable and population data. This approach is a really simple but effective way of identifying communities underserved by EV charging locations.